Australia’s only fundraising benchmarking for large and small not-for-profits compares return on investment across eight types of fundraising.
Our macro reporting is based on seven years of data from over 80 organisations with a combined income over the period of $6.8b. This incredibly robust data set will compare your:
Use it to:
We have created three tiers of benchmarking to best meet the needs of different organisations.
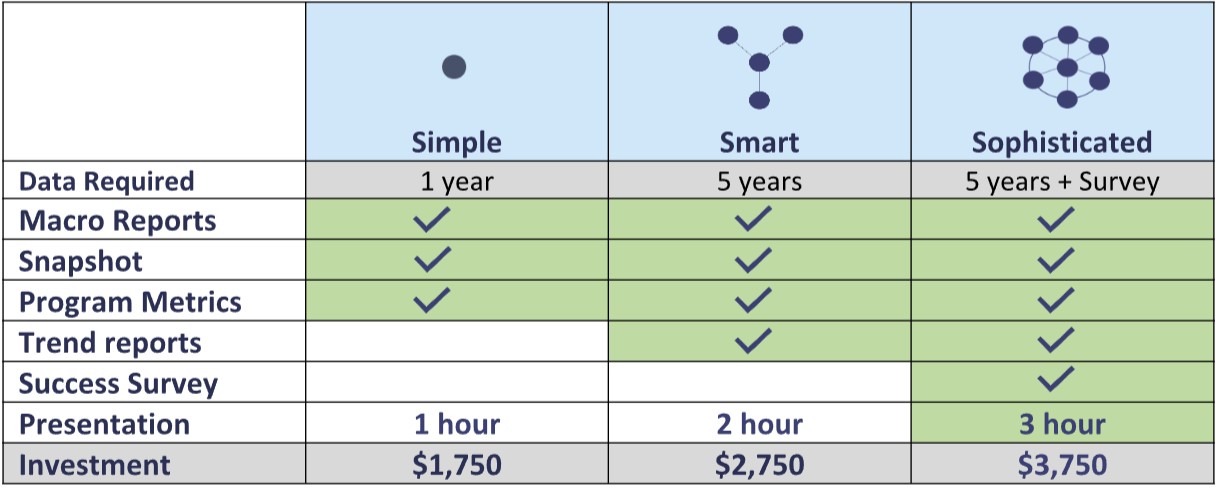
These summaries are valuable for showing results at a leadership level covering annual and 5 year growth in gross and net terms, changes in return, market share and income per head of population.
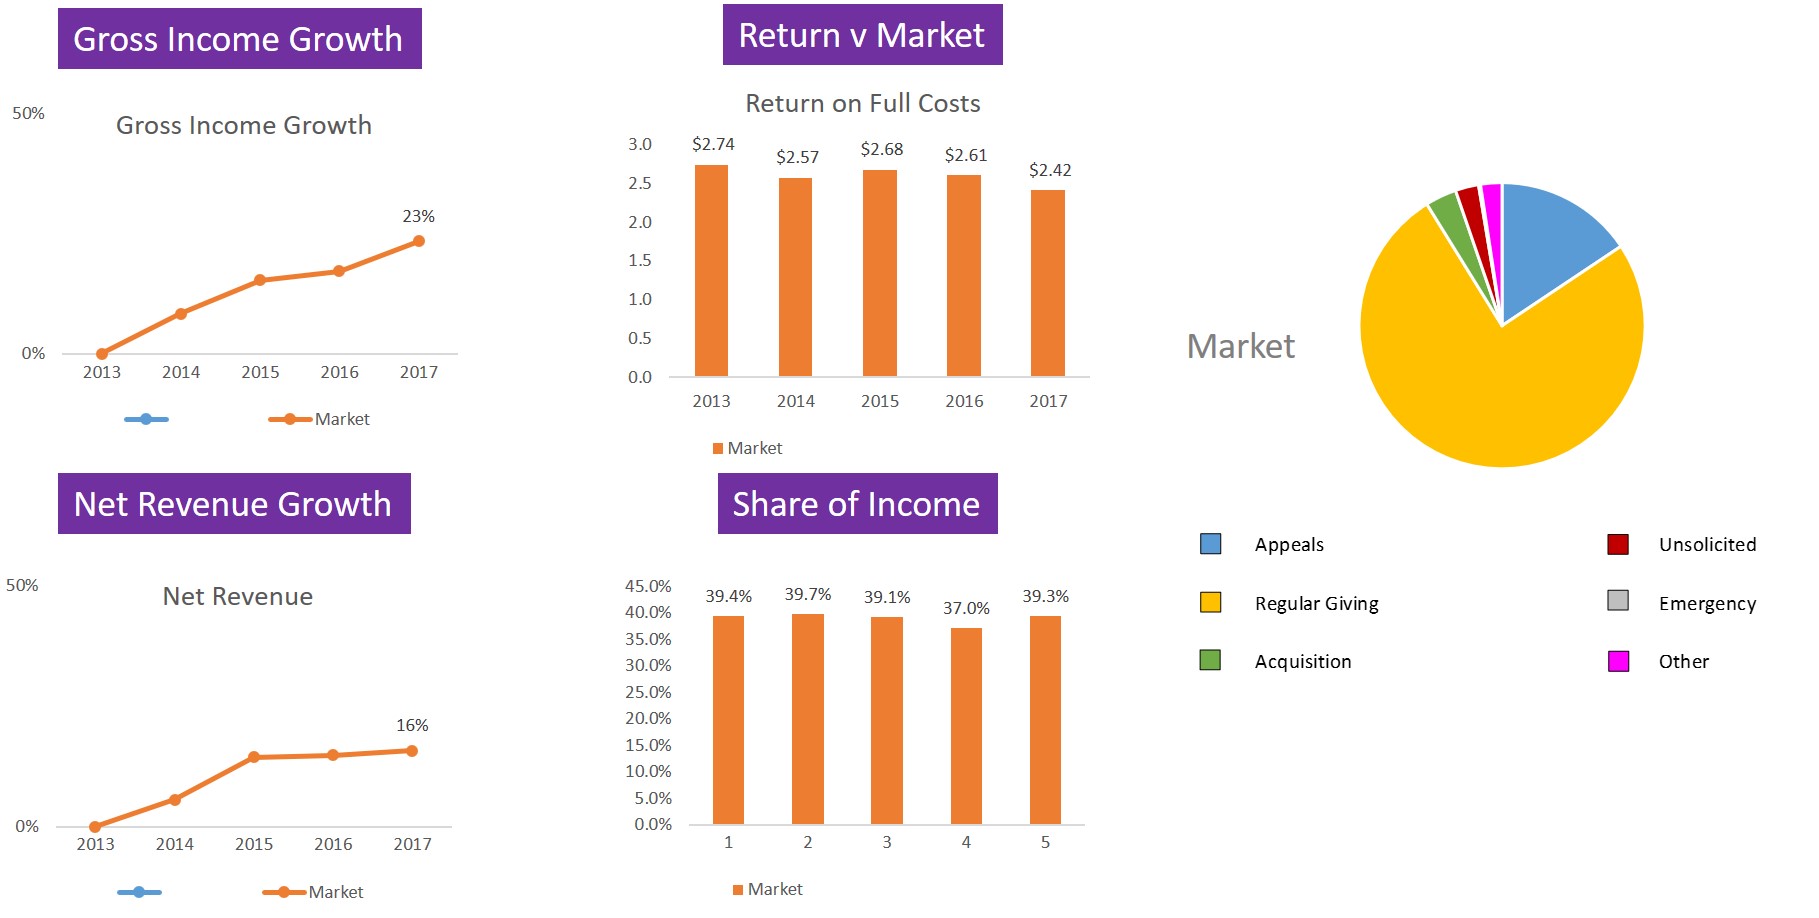
Our macro analysis covers nearly $4.5b of income across 66 charities over the past 5 years to give a robust picture of return rates.
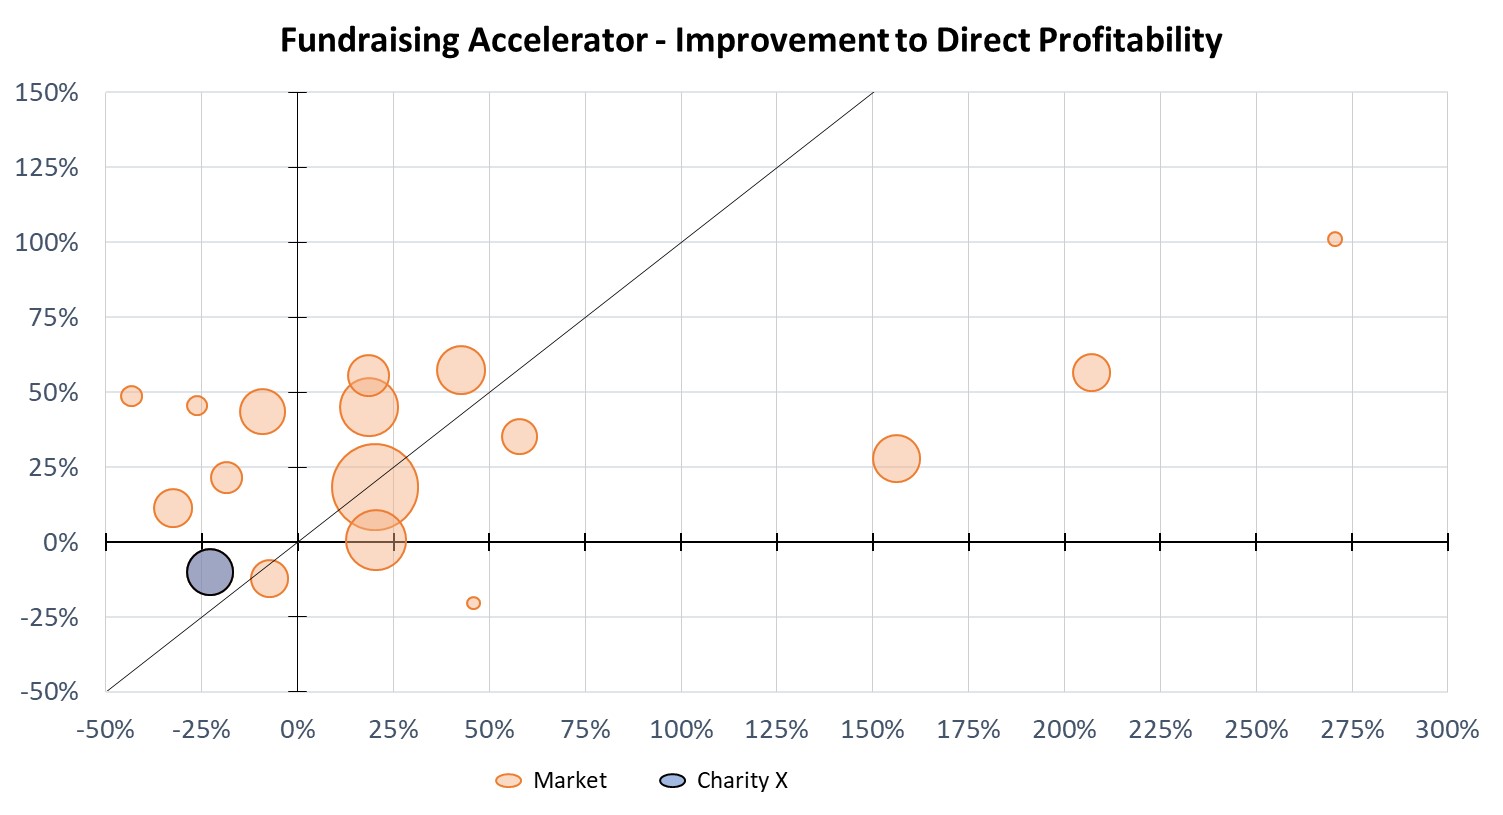
Our accelerator charts show the rate of change in income compared to the rate of change in expenditure by size of organisation helping you to quickly see if your program is over or under performing compared to others.
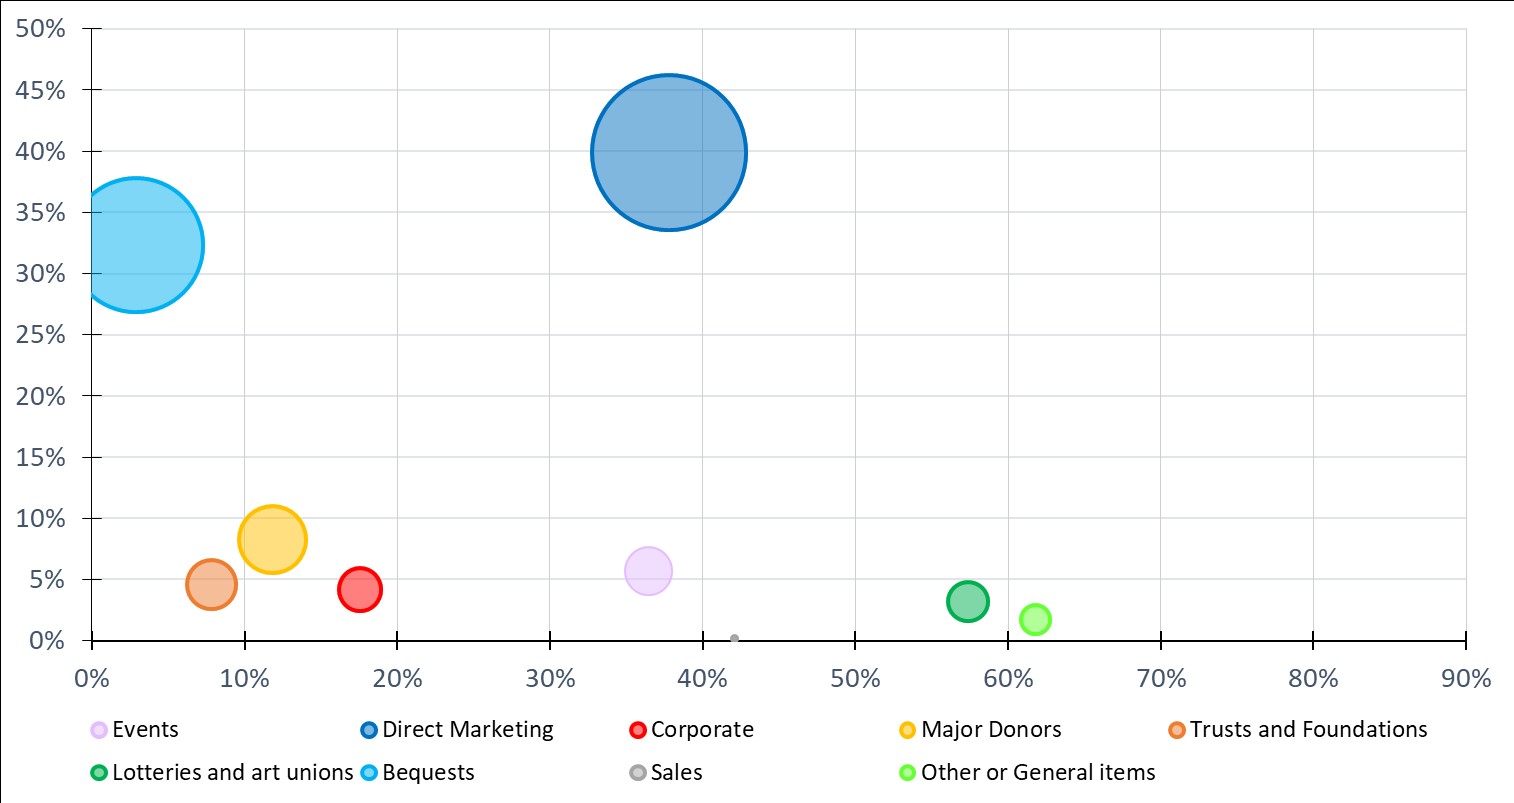
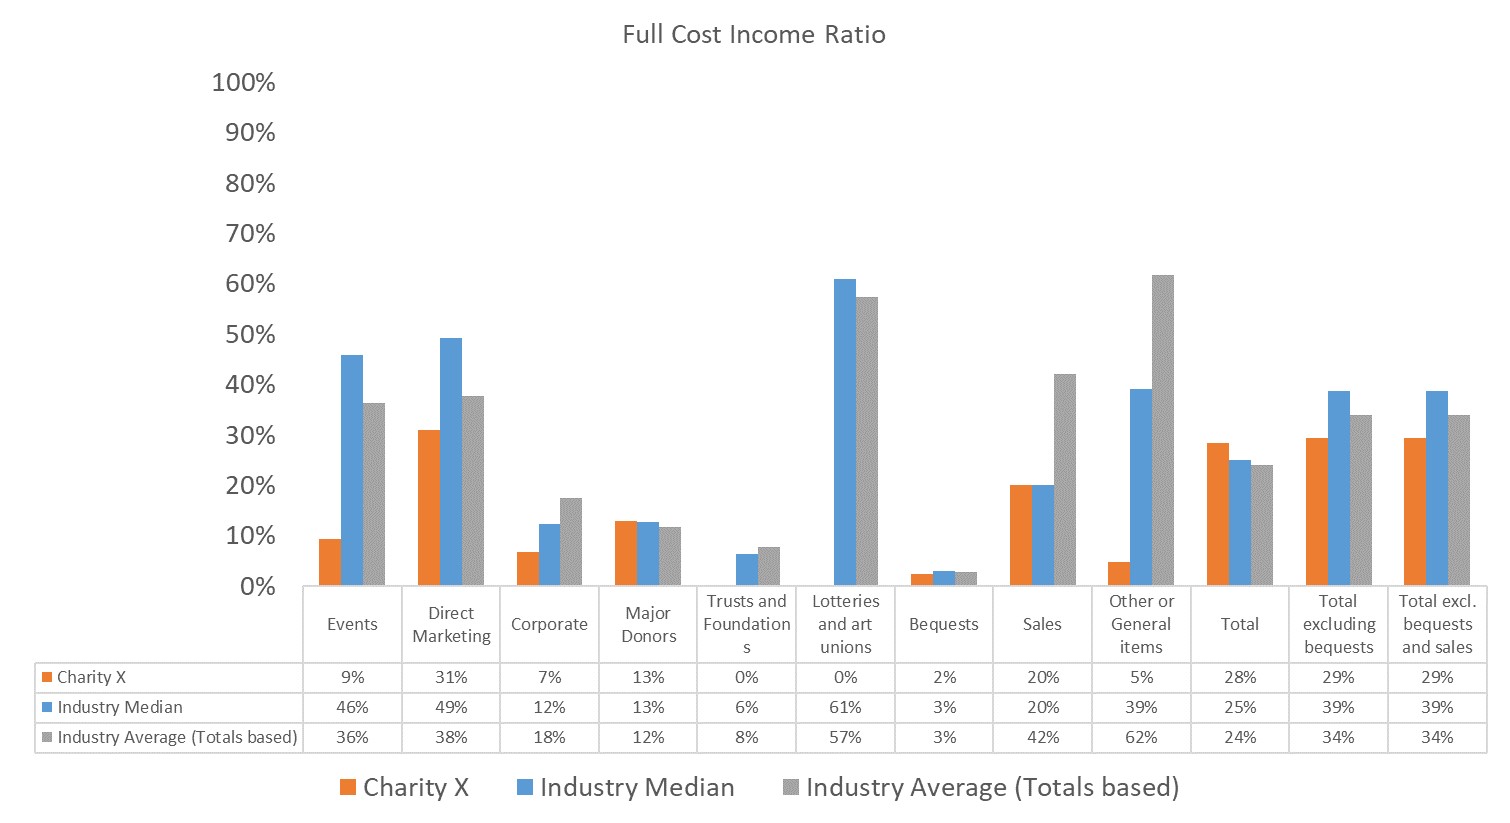
We provide a detailed breakdown of the reliance for each type of fundraising and compare this to the cost income ratio by size of charity allowing you see at a glance where to focus your efforts in the future.
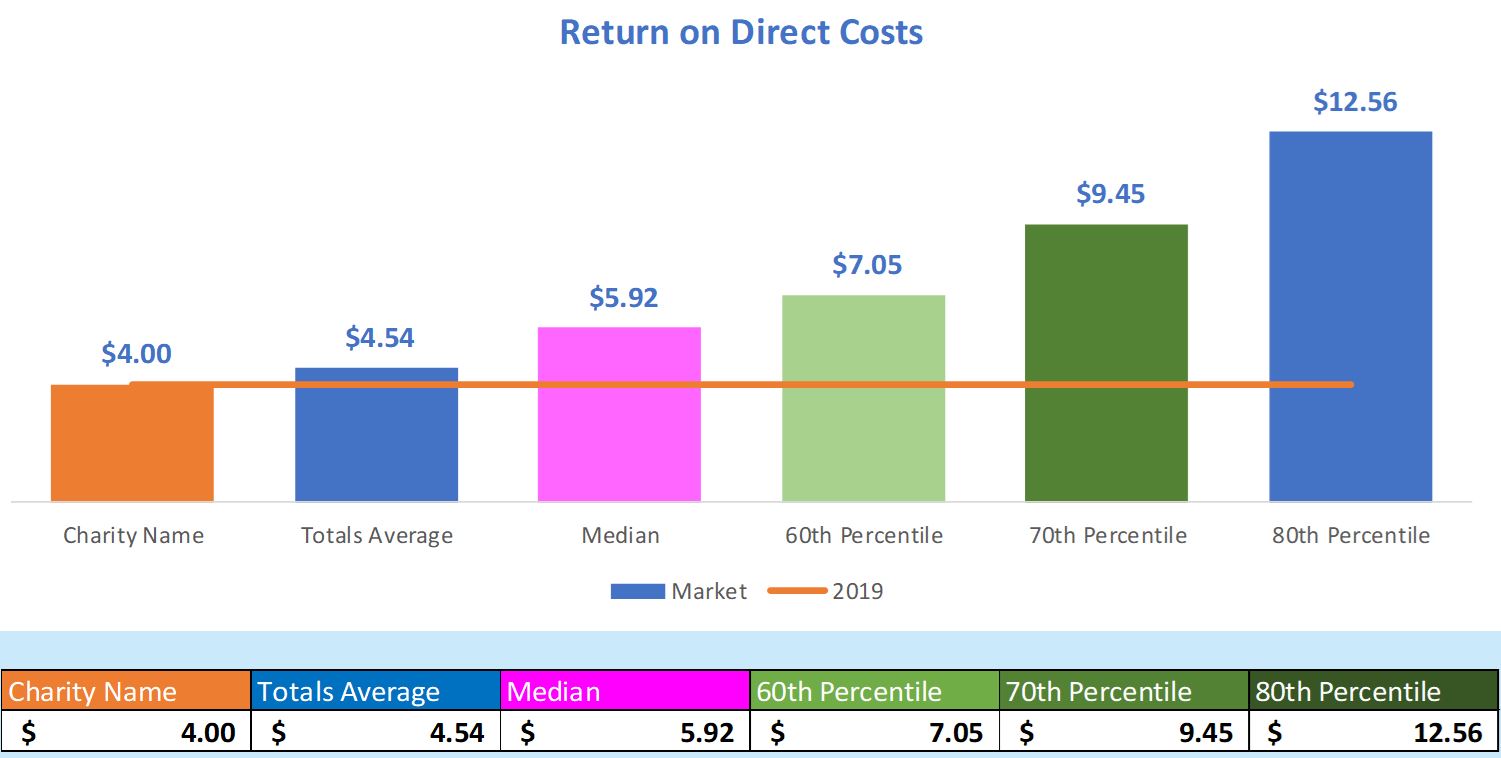
Return and ratio reports show the return compared to each organisation, organised by size,
so you can make a more effective comparison.
Sign up to our Sophisticated Benchmarking Tier to get unique access to a study of the fundraising
success enablers across your organisation.
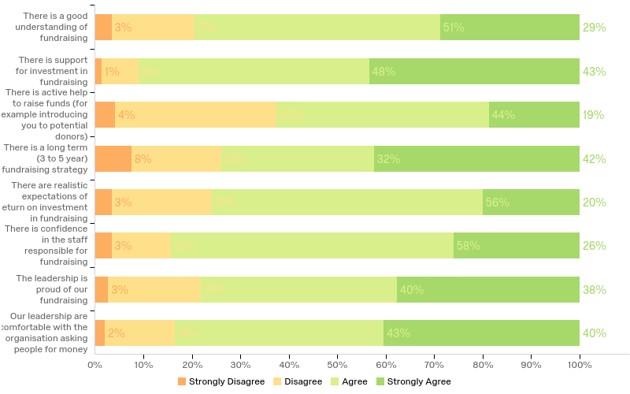
Fundraising success comes from a unique combination of an organisational culture that loves to fundraise, great insights about why people give and a well-resourced realistic strategy for growth.
More Strategic has developed and delivered a 15-question survey that assesses and benchmarks the key drivers of fundraising performance across 4 key areas;
Context
Activity
Success Drivers
Experience Management
We will invite organisational leaders and the fundraising team to complete the survey and in the workshop share the findings from across the organisation and in comparison to other not for profits.
Join us in unlocking the full potential of your charity’s fundraising efforts through our upcoming webinars on the transformative More Profitability Benchmarking package.
During these webinars, we aim to provide you with practical knowledge on the following topics:
Email: martin@morestrategic.com.au
Call: 0435306202
We are proud to have partnered with the Benchmarking Project since 2022 to deliver more robust and conclusive evidence of our profitability benchmarking by incorporating their meticulous transactional analysis.
To gain a deeper insight into The Benchmarking Project and their expertise, please follow this link:
https://www.benchmarkingproject.org/.
Experience Management
Marketing & Research
Email – martin@morestrategic.com.au Phone – 0435 306 202
A finely honed, influential supporter survey to drive Gift In Will, Mid Value and other leads whilst delivering powerful, actionable insights.